Using our new Event Ticketing Analytics, which we call Attendalytics, you will be able to learn more about your ticket buyers, ticket sales page visits or sessions (and when these happen), plus tie them all together to see the bigger picture.
Our goal with Event Ticketing Analytics is to allow you, the event manager, to see analytical data that helps you make actionable decisions. We started to explore event analytics when we started working with our friends at Herb Gillen Advertising. They are event data-driven and use this to deliver results for their customers.
When we started down the path to help event managers increase online ticket sales, we started with event analytics and easy-to-read event reports, helping event managers spot the trends and develop solutions.
Getting Started with Event Ticketing Analytics
The problem with analytics of any type is. . . getting started. The reason? Because it seems hard–not because it actually is hard. Now you might think that’s easy for me to say since I own a ticketing company, but really, I do not spend much of my time looking at event ticketing analytics. This is why I worked with our team; to make it easy.
Here’s a sample report from our Attendalytics Dashboard so you can see what I mean:
The first image is a cumulative report, which shows the total orders and sessions over time.
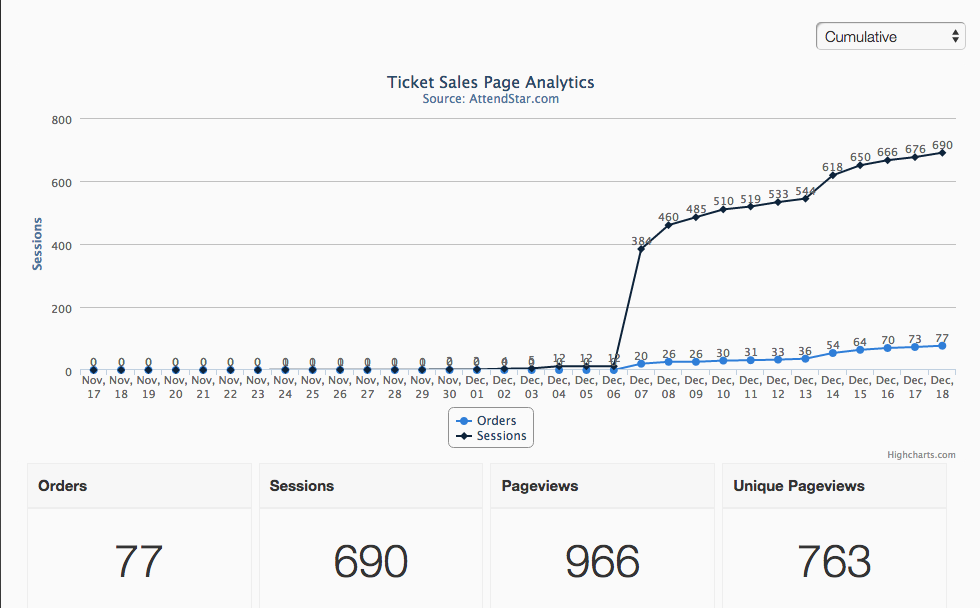
What I like looking at in the above report is the interest shown in the event. What interest might mean is who would potentially buy tickets. In this case, 690 people visited and placed 77 orders. Which means to me that there are 613 people that visited the site and did not buy tickets.
If I look at the number of tickets sold for this event I see the number is 256, about 3.3 tickets per order. Then I go back and look at another event we did and see that at this same point in time using our new Event Comparison Report I see that the two events had about the same results at the exact same point in time and my first event sold 3,871 tickets for 1,290 orders. So if I was going to look at a trend or able to forecast I would say this event will also sell roughly the same number of tickets.
Like most graphs and analytics it’s not any single point of data, but data collected across events compared to each other where the story begins to unfold.
Our goal at AttendStar is to help you hold profitable events and plan your advertising and marketing spend and that’s where event reports like this come into play.
Below is a distributive report since it reflects orders and session amounts for each day.
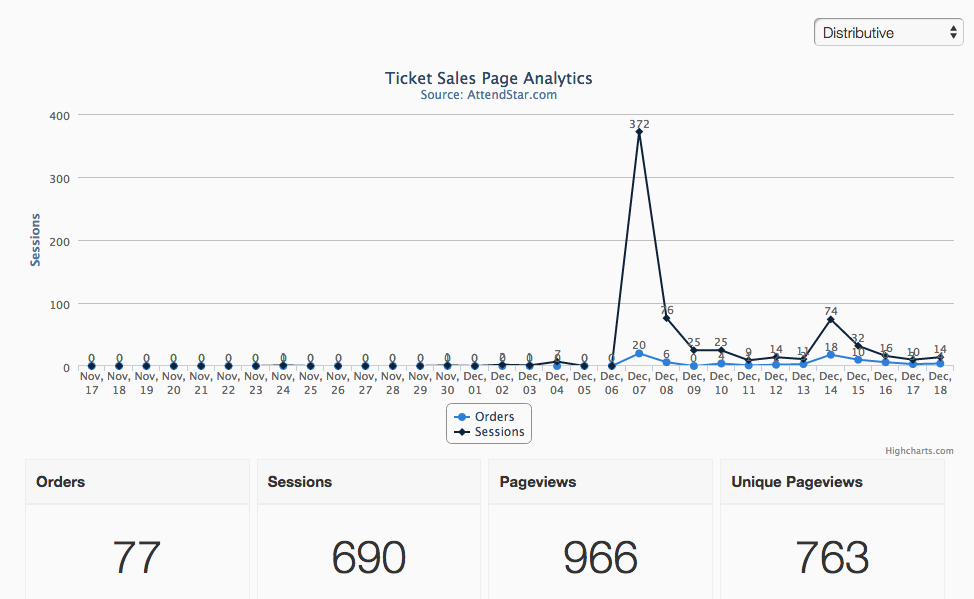
Have comments, or suggestions? Let’s start a discussion below.
