Data, data, data! It seems like everywhere you look marketers, business people, and even event organizers are obsessed with analytics. We can track so much these days that it’s easy to get caught up in data paralysis. In other words, we fail to take risks and take action unless we have data to support those our actions. As long as you’re not letting data impede your success, you’re okay. Gather that data! Crunch those numbers! They’re very valuable if you know how to use them. In fact, using Google Analytics, you can significantly increase event ticket sales and the return on investment for your promotional efforts.
When you use AttendStar to sell tickets to your events, Google Analytics is integrated directly into your ticket sales page. Many of the reports you’ll need to boost ticket sales are available without leaving your AttendStar dashboard at no extra charge and with no extra coding! For even more advanced tracking or to track your audience on your own website, you can dive into your free Google Analytics account. Below are some ways you can start using Google Analytics both within AttendStar and through your Google Analytics account to sell more event tickets.
Goals
The first thing you should do is make sure the appropriate Google Analytics tracking code has been added to your event website. I highly recommend that you use Google Tag Manager to manage your various embed codes (e.g., for Google Analytics, Google AdWords, Facebook pixels, other online advertising, and so on). It makes things so much easier for you because it keeps everything organized in one place!
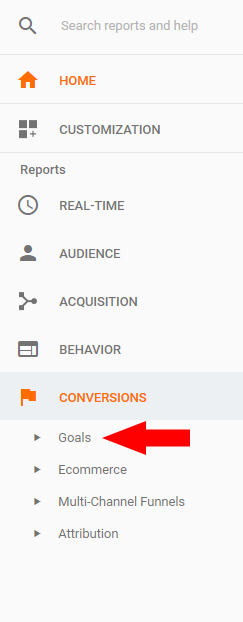
Once Google Analytics is up and running, click the Goals link under the Conversions heading in the sidebar to set up some goals (see the image below).
When you’re thinking about tracking, you should have some key performance indicators (KPIs) in mind to measure your investments against. Your goals should be trackable conversions. For example, a ticket purchase is a perfect goal to set up here! You’ll use this goal as you look at your visitor sources, page performance, and so on.
From here, you can track acquisitions to see where visitors to your site are coming from and measure those visits against your goal. If you invested in Google AdWords to drive traffic and sell tickets, you can determine if that advertising investment paid off in actual ticket sales. The objective, of course, is to drive your cost per conversion as low as possible, and this analysis is extremely helpful.
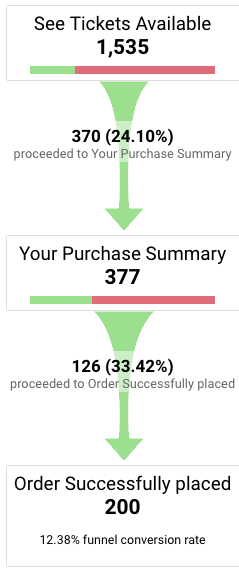
AttendStar President Gary Bradshaw recommends creating a goal funnel that tracks the entire check-out purchase funnel. Since prospective ticket buyers can land on the first step of the checkout process from many places, such as search engines, social media, email campaigns, and more, this report pulls all of the sources together to give you a completely accurate count.
In the image below, you can see where people dropped off in the check-out purchase funnel and where remarketing campaigns would be most useful. In fact, it was this report that lead AttendStar to develop its Remind Me feature, which allows you to automate the process of sending targeted email messages to people who ask to be reminded about your event but haven’t purchased tickets yet.
Audience
Google Analytics can also help you understand who your audience is. Who is visiting your ticket sales page? Are they the right people? In other words, are your marketing efforts driving people to your ticket sales page who might actually buy tickets?
Furthermore, you might be surprised to see how many people visit your ticket sales page from mobile devices. It’s probably more than half, and you can see this percentage in your Google Analytics account. Bottom-line, if your ticket sales page isn’t mobile-friendly, you’re probably losing ticket sales.
Your Google Analytics data can tell you how people arrived on your event website or ticket sales page. They might have come from an organic search using a search engine like Google. They might have come from one of your ads. They might even come from a social media post, blog post, or elsewhere. Knowing how traffic gets to your site is important to determine which of your marketing investments are working.
You can combine this data with the goals you set up in Google Analytics to learn things like how many people buy tickets the first time they visit your ticket sales page versus how many are returning visitors. Through this analysis, you might spot opportunities to improve your on-page messaging or invest in some ad retargeting.
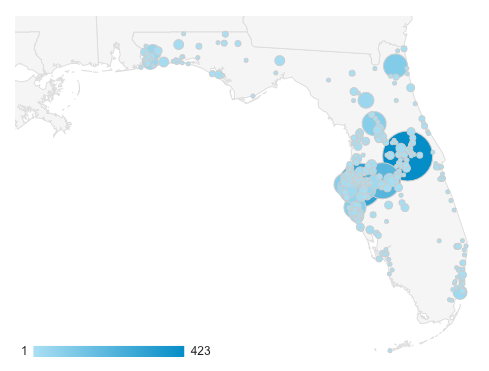
For virtual or regional events where ticket buyers come from large geographic areas, AttendStar President Gary Bradshaw recommends looking at the Ticket Buyer Map within your AttendStar account. You can use the map to plan where to do advertising or invest in other marketing initiatives to get the highest returns on your investments.
For example, the Ticket Buyer Map below shows exactly how many ticket orders came in for each city in Florida for an event. Clearly, the Orlando and Tampa areas are the hot spots, but depending on the actual numbers, it might be worth it to invest in some advertising in Jacksonville or Gainesville. Based on this map, the event organizer might even consider holding a future similar event in the Jacksonville area where there appears to be a lot of interest.
Conversions
There is so much to be learned from people who already bought tickets for your event, and you can access this data in Google Analytics as well as within your AttendStar dashboard. Ticket buyer data can help you determine the best day of the week for sales, identify traffic spikes or dips over time, and more.
In your AttendStar dashboard, you can access a ticket sales chart that shows sales over time (cumulative) and sales by day (distributive). You can see both charts in the images below.
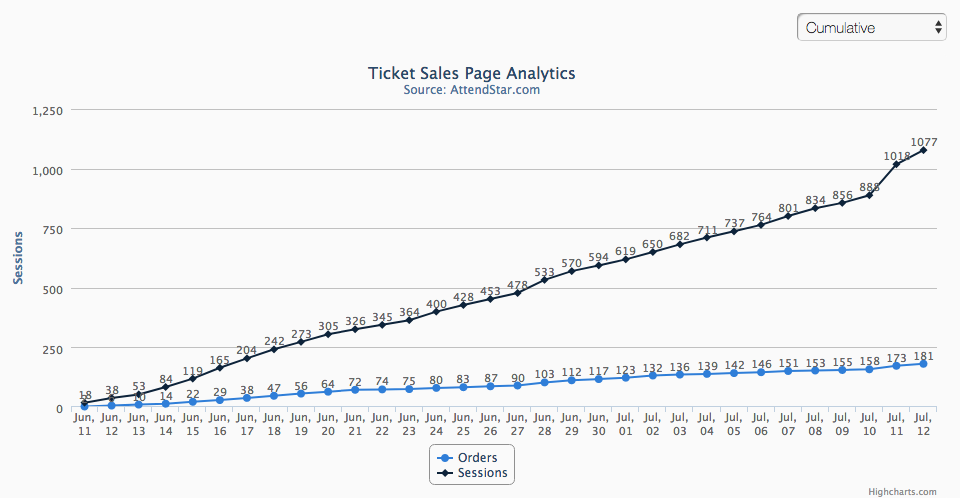
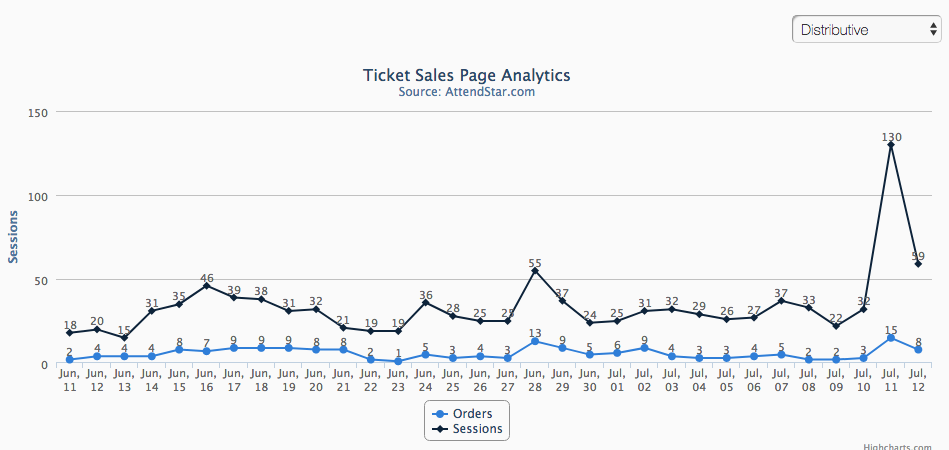
AttendStar President Gary Bradshaw sees ticket sellers use this report often to track marketing investment performance. By printing out these charts and drawing timelines for your various campaigns directly on the chart, you can note when specific radio, television, online, and Facebook ads ran. You can even include social media posts, contests, outreach efforts, email marketing, and more. Data spikes that correspond with specific marketing campaigns most likely mean that campaign was successful and could warrant a budget increase. For data dips that correspond with specific marketing campaigns, the opposite is probably true and budget cuts might be wise.
The Power of Google Analytics to Increase Event Ticket Sales
The power of data and Google Analytics to increase event ticket sales comes from your willingness and ability to extract and interpret the data. Gary Bradshaw explains, “Sometimes it’s valuable to just look at the data and see where the data takes you. Sometimes data answers a question, and sometimes it leads to the next question. Just don’t let Google Analytics overwhelm you with all the reports! You only care about a few of them, and some of the most important analytics features have already been built into AttendStar, so a separate Google account might not even be needed.”
If you use AttendStar to sell event tickets and want help setting up reports to track your sales more effectively, contact Gary Bradshaw at AttendStar (615-223-1973) or use the Contact Us Form.
